US 50 States Quarters coins - catalog with values
Face value: Quarter ($1/4=25 cents)
copper-nickel clad copper
24.3 mm.
5.67 g.
Edge: Reeded
Value for any coin in UNC condition approximate $1
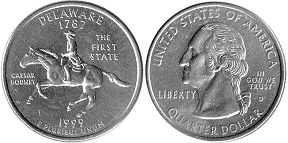
1/4 dollar 1999 Delaware
Caesar Rodney on horseback / DELAWARE 1787 / CAESAR RODNEY / THE FIRST STATE / 1999 E PLURIBUS UNUM
QUARTER DOLLAR / UNITED STATES OF AMERICA / LIBERTY / IN GOD WE TRUST
KM#293
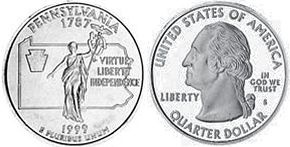
1/4 dollar 1999 Pennsylvania
Commonwealth statue, state outline, keystone / PENSYLVANIA 1787 / VIRTUE LIBERTY INDEPENDENCE / 1999 E PLURIBUS UNUM
QUARTER DOLLAR / UNITED STATES OF AMERICA / LIBERTY / IN GOD WE TRUST
KM#294
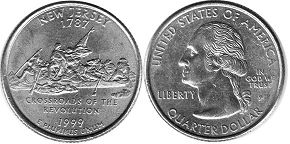
1/4 dollar 1999 New Jersey
Washington Crossing the Delaware - George Washington standing and James Monroe holding the flag / NEW JERCEY 1787 / CROSSROADS OF THE REVOLUTION / 1999 E PLURIBUS UNUM
QUARTER DOLLAR / UNITED STATES OF AMERICA / LIBERTY / IN GOD WE TRUST
KM#295
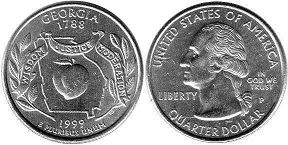
1/4 dollar 1999 Georgia
Peach, live oak (state tree) sprigs, state outline / GEORGIA 1788 / WITHDOM JUSTICE MODERATION / 1999 E PLURIBUS UNUM
QUARTER DOLLAR / UNITED STATES OF AMERICA / LIBERTY / IN GOD WE TRUST
KM#296
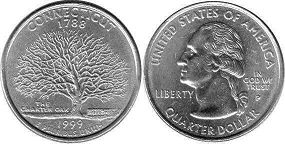
1/4 dollar 1999 Connecticut
The Charter Oak Tree / CONNECTICUT 1788 / THE CHARTER OAK / 1999 E PLURIBUS UNUM
QUARTER DOLLAR / UNITED STATES OF AMERICA / LIBERTY / IN GOD WE TRUST
KM#297
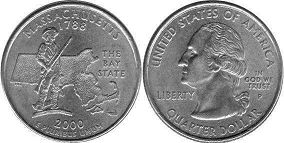
1/4 dollar 2000 Massachusetts
The Minute Man statue, state outline / MASSACHUSETTS 1788 / THE BAY STATE / 2000 E PLURIBUS UNUM
QUARTER DOLLAR / UNITED STATES OF AMERICA / LIBERTY / IN GOD WE TRUST
KM#305
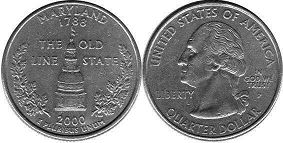
1/4 dollar 2000 Maryland
Dome of the Maryland State House, white oak clusters / MARYLAND 1788 / THE OLD LINE STATE / 2000 E PLURIBUS UNUM
QUARTER DOLLAR / UNITED STATES OF AMERICA / LIBERTY / IN GOD WE TRUST
KM#306
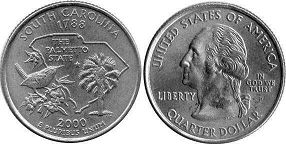
1/4 dollar 2000 South Carolina
Carolina wren, yellow Jessamine and cabbage palmetto, state outline / SOUTH CAROLINA 1788 / THE PALMETTO STATE / 2000 E PLURIBUS UNUM
QUARTER DOLLAR / UNITED STATES OF AMERICA / LIBERTY / IN GOD WE TRUST
KM#307
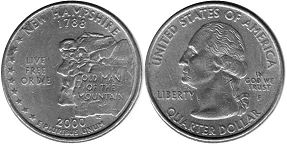
1/4 dollar 2000 New Hampshire
Old Man of the Mountain, nine stars / NEW HAMPSHIRE 1788 / LIVE FREE OR DIE / OLD MAN OF THE MOUNTAINS / 1999 E PLURIBUS UNUM
QUARTER DOLLAR / UNITED STATES OF AMERICA / LIBERTY / IN GOD WE TRUST
KM#308
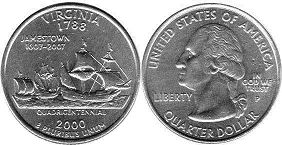
1/4 dollar 2000 Virginia
Ships Susan Constant, Godspeed, Discovery / VIRGINIA 1788 / JAMESTOWN 1607-2007 / QUADRECENTINIAL / 2000 E PLURIBUS UNUM
QUARTER DOLLAR / UNITED STATES OF AMERICA / LIBERTY / IN GOD WE TRUST
KM#309
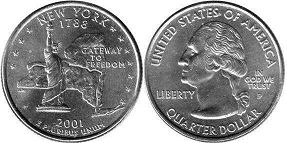
1/4 dollar 2001 New York
Statue of Liberty, 11 stars, state outline with line tracing Hudson River and Erie Canal / NEW YORK 1788 / GATEWAY TO FREEDOM / 2001 E PLURIBUS UNUM
QUARTER DOLLAR / UNITED STATES OF AMERICA / LIBERTY / IN GOD WE TRUST
KM#318
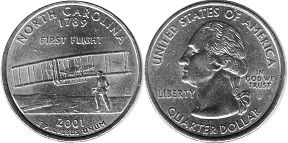
1/4 dollar 2001 North Carolina
Wright Flyer, John T. Daniels's iconic photo of the Wright brothers / NORTH CAROLINA 1789 / FIRST FLIGHT / 2001 E PLURIBUS UNUM
QUARTER DOLLAR / UNITED STATES OF AMERICA / LIBERTY / IN GOD WE TRUST
KM#319
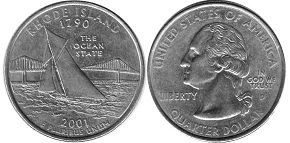
1/4 dollar 2001 Rhode Island
America's Cup yacht Reliance on Narragansett Bay, Claiborne Pell Newport Bridge / RHODE ISLAND 1790 / THE OCEAN STATE / 2001 E PLURIBUS UNUM
QUARTER DOLLAR / UNITED STATES OF AMERICA / LIBERTY / IN GOD WE TRUST
KM#320
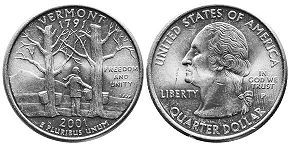
1/4 dollar 2001 Vermont
Maple trees with sap buckets, Camel's Hump Mountain / VERMONTH 1791 / FREEDOM AND UNITY / 2001 E PLURIBUS UNUM
QUARTER DOLLAR / UNITED STATES OF AMERICA / LIBERTY / IN GOD WE TRUST
KM#321
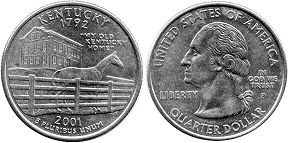
1/4 dollar 2001 Kentucky
Thoroughbred racehorse behind fence, Bardstown mansion, Federal Hill / KENTUCKY 1792 / MY OLD KENTUCKY HOME / 2001 E PLURIBUS UNUM
QUARTER DOLLAR / UNITED STATES OF AMERICA / LIBERTY / IN GOD WE TRUST
KM#322
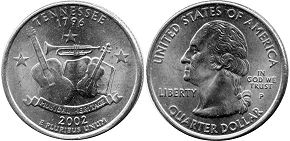
1/4 dollar 2002 Tennessee
Fiddle, trumpet, guitar, musical score, three stars / TENNESSEE 1796 / MUSICAL HERITAGE / 2002 E PLURIBUS UNUM
QUARTER DOLLAR / UNITED STATES OF AMERICA / LIBERTY / IN GOD WE TRUST
KM#331
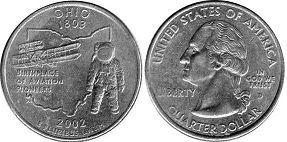
1/4 dollar 2002 Ohio
Wright Flyer, astronaut, state outline / OHIO 1803 / BIRTPLACE OF AVIATION PIONEERS / 2002 E PLURIBUS UNUM
QUARTER DOLLAR / UNITED STATES OF AMERICA / LIBERTY / IN GOD WE TRUST
KM#332
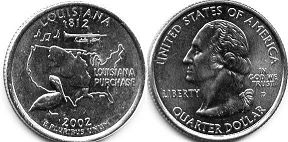
1/4 dollar 2002 Louisiana
Brown pelican, trumpet with musical notes, outline of Louisiana Purchase on map of US / LOUISIANA 1812 / LOUISIANA PURCHASE / 2002 E PLURIBUS UNUM
QUARTER DOLLAR / UNITED STATES OF AMERICA / LIBERTY / IN GOD WE TRUST
KM#333
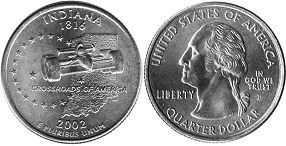
1/4 dollar 2002 Indiana
Indy Car, state outline, 19 stars / INDIANA 1816 / CROSSROADS OF AMERICA / 2002 E PLURIBUS UNUM
QUARTER DOLLAR / UNITED STATES OF AMERICA / LIBERTY / IN GOD WE TRUST
KM#334
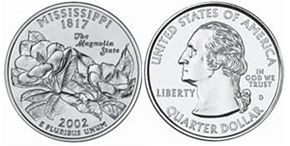
1/4 dollar 2002 Mississippi
Two magnolia blossoms / MISSISSIPPI 1817 / THE MAGNOLIA STATE / 2002 E PLURIBUS UNUM
QUARTER DOLLAR / UNITED STATES OF AMERICA / LIBERTY / IN GOD WE TRUST
KM#335
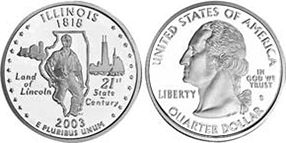
1/4 dollar 2003 Illinois
Abraham Lincoln - farm scene, Chicago skyline, state outline, 21 stars / ILLINOIS 1818 / LAND OF LINCOLN / 21st STATE CENTURY / 2003 E PLURIBUS UNUM
QUARTER DOLLAR / UNITED STATES OF AMERICA / LIBERTY / IN GOD WE TRUST
KM#343
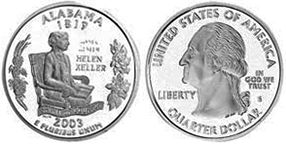
1/4 dollar 2003 Alabama
Helen Keller seated, longleaf pine, branch, magnolia blossoms / ALABAMA 1819 / HELEN KELLER / SPIRIT OF COURAGE / 2003 E PLURIBUS UNUM
QUARTER DOLLAR / UNITED STATES OF AMERICA / LIBERTY / IN GOD WE TRUST
KM#344
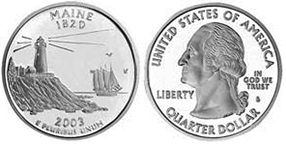
1/4 dollar 2003 Maine
Pemaquid Point Lighthouse; the schooner Victory Chimes at sea / MAINE 1820 / 2003 E PLURIBUS UNUM
QUARTER DOLLAR / UNITED STATES OF AMERICA / LIBERTY / IN GOD WE TRUST
KM#345
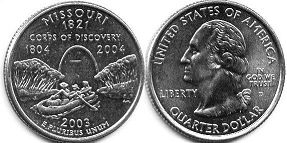
1/4 dollar 2003 Missouri
Gateway Arch, Lewis and Clark and York returning down Missouri River / MISSOURY 1821 / CORPS OF DISCOVERY 1804 2004 / 2003 E PLURIBUS UNUM
QUARTER DOLLAR / UNITED STATES OF AMERICA / LIBERTY / IN GOD WE TRUST
KM#346
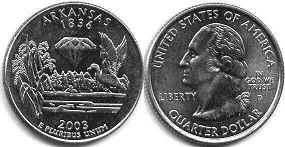
1/4 dollar 2003 Arkansas
Diamond, rice stalks, mallard flying above a lake / ARKANZAS 1836 / 2003 E PLURIBUS UNUM
QUARTER DOLLAR / UNITED STATES OF AMERICA / LIBERTY / IN GOD WE TRUST
KM#347
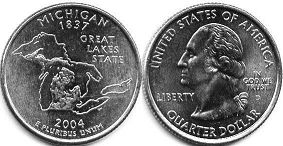
1/4 dollar 2004 Michigan
State outline, outline of Great Lakes system / MICHIGAN 1837 / GREAT LAKES STATE / 2004 E PLURIBUS UNUM
QUARTER DOLLAR / UNITED STATES OF AMERICA / LIBERTY / IN GOD WE TRUST
KM#355
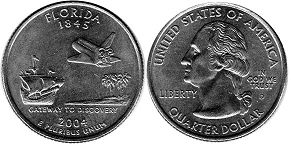
1/4 dollar 2004 Florida
Spanish galleon, Sabal palmetto, Space Shuttle / FLORIDA 1845 / GATEWAY TO DISCOVEY / 2004 E PLURIBUS UNUM
QUARTER DOLLAR / UNITED STATES OF AMERICA / LIBERTY / IN GOD WE TRUST
KM#356
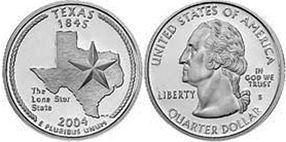
1/4 dollar 2004 Texas
State outline, star, lariat / TEXAS 1845 / THE LOAN STAR STATE / 2004 E PLURIBUS UNUM
QUARTER DOLLAR / UNITED STATES OF AMERICA / LIBERTY / IN GOD WE TRUST
KM#357
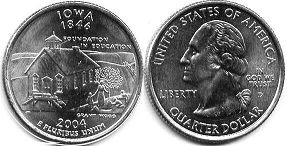
1/4 dollar 2004 Iowa
Schoolhouse, teacher and students planting a tree / IOWA 1846 / 2004 E PLURIBUS UNUM
QUARTER DOLLAR / UNITED STATES OF AMERICA / LIBERTY / IN GOD WE TRUST
KM#358
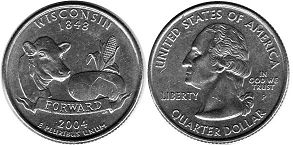
1/4 dollar 2004 Wisconsin
Head of a cow, round of cheese and ear of corn / WISCONSIN 1848 / FORWARD / 2004 E PLURIBUS UNUM
QUARTER DOLLAR / UNITED STATES OF AMERICA / LIBERTY / IN GOD WE TRUST
KM#359
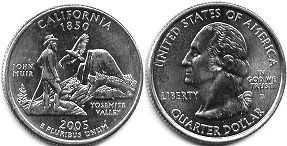
1/4 dollar 2005 California
John Muir, California condor, Half Dome / CALIFORNIA 1850 / JOHN MUIR / YOSEMITE VALLEY / 2005 E PLURIBUS UNUM
QUARTER DOLLAR / UNITED STATES OF AMERICA / LIBERTY / IN GOD WE TRUST
KM#370
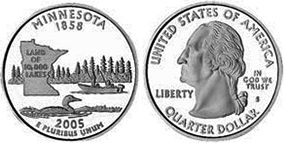
1/4 dollar 2005 Minnesota
Common loon, fishing, state outline / MINNESOTA 1858 / LAND OF 10,000 LAKES / 2005 E PLURIBUS UNUM
QUARTER DOLLAR / UNITED STATES OF AMERICA / LIBERTY / IN GOD WE TRUST
KM#371
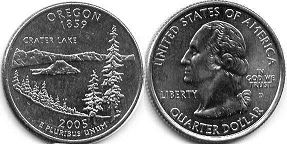
1/4 dollar 2005 Oregon
Crater Lake National Park / OREGON 1859 / GREATER LAKE / 2005 E PLURIBUS UNUM
QUARTER DOLLAR / UNITED STATES OF AMERICA / LIBERTY / IN GOD WE TRUST
KM#372
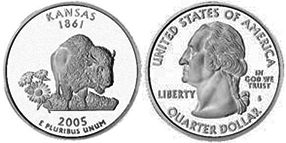
1/4 dollar 2005 Kansas
American bison, sunflowers / KANSAS 1861 / 2005 E PLURIBUS UNUM
QUARTER DOLLAR / UNITED STATES OF AMERICA / LIBERTY / IN GOD WE TRUST
KM#373
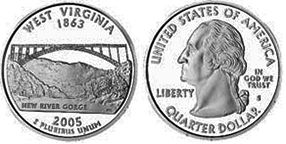
1/4 dollar 2005 West Virginia
New River Gorge Bridge / WEST VIRGINIA 1863 / NEW RIVER GORGE / 2005 E PLURIBUS UNUM
QUARTER DOLLAR / UNITED STATES OF AMERICA / LIBERTY / IN GOD WE TRUST
KM#374
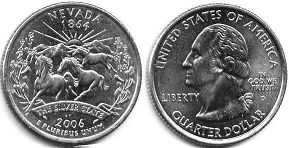
1/4 dollar 2006 Nevada
Mustangs, mountains, rising sun, sagebrush / NEVADA 1864 / THE SILVER STATE / 2006 E PLURIBUS UNUM
QUARTER DOLLAR / UNITED STATES OF AMERICA / LIBERTY / IN GOD WE TRUST
KM#382
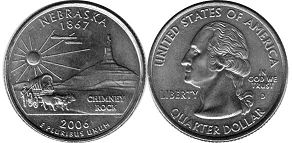
1/4 dollar 2006 Nebraska
Chimney Rock National Historic Site, Conestoga wagon / NEBRASKA 1867 / CHIMNEY ROCK / 2006 E PLURIBUS UNUM
QUARTER DOLLAR / UNITED STATES OF AMERICA / LIBERTY / IN GOD WE TRUST
KM#383
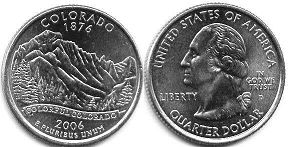
1/4 dollar 2006 Colorado
Longs Peak / COLORADO 1876 / COLORFUL COLORADO / 2006 E PLURIBUS UNUM
QUARTER DOLLAR / UNITED STATES OF AMERICA / LIBERTY / IN GOD WE TRUST
KM#384
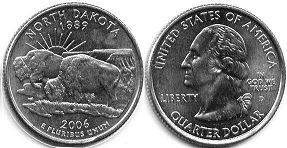
1/4 dollar 2006 North Dakota
American bison, badlands / NORTH DAKOTA 1889 / 2006 E PLURIBUS UNUM
QUARTER DOLLAR / UNITED STATES OF AMERICA / LIBERTY / IN GOD WE TRUST
KM#385
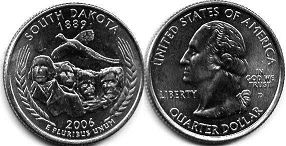
1/4 dollar 2006 South Dakota
Mount Rushmore, ring-necked pheasant, wheat / SOUTH DAKOTA 1889 / 2006 E PLURIBUS UNUM
QUARTER DOLLAR / UNITED STATES OF AMERICA / LIBERTY / IN GOD WE TRUST
KM#386
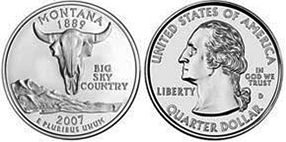
1/4 dollar 2007 Montana
American bison skull in the center with mountains and the Missouri River in the background / MONTANA 1889 / BIG SKY COUNTRY / 2007 E PLURIBUS UNUM
QUARTER DOLLAR / UNITED STATES OF AMERICA / LIBERTY / IN GOD WE TRUST
KM#396
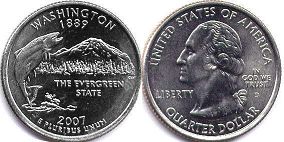
1/4 dollar 2007 Washington
Salmon leaping in front of Mount Rainier / WASHINGTON 1889 / THE EVERGREEN STATE / 2007 E PLURIBUS UNUM
QUARTER DOLLAR / UNITED STATES OF AMERICA / LIBERTY / IN GOD WE TRUST
KM#397
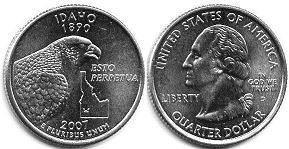
1/4 dollar 2007 Idaho
Peregrine falcon, state outline with star indicating location of state capital Boise / IDAHO 1890 / ESTA PERFETUA / 2007 E PLURIBUS UNUM
QUARTER DOLLAR / UNITED STATES OF AMERICA / LIBERTY / IN GOD WE TRUST
KM#398
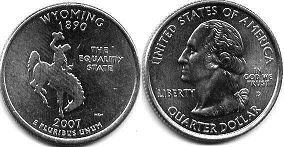
1/4 dollar 2007 Wyoming
Bucking Horse and Rider / WYOMING 1890 / THE EQUALITY STATE / 2007 E PLURIBUS UNUM
QUARTER DOLLAR / UNITED STATES OF AMERICA / LIBERTY / IN GOD WE TRUST
KM#399
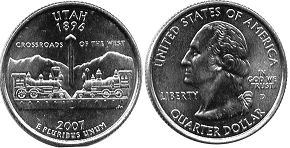
1/4 dollar 2007 Utah
Golden spike, Locomotives Jupiter and the completion of the Transcontinental Railroad / UTAH 1896 / CROSSROADS OF THE WEST / 2007 E PLURIBUS UNUM
QUARTER DOLLAR / UNITED STATES OF AMERICA / LIBERTY / IN GOD WE TRUST
KM#400
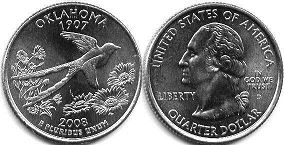
1/4 dollar 2008 Oklahoma
Scissor-tailed flycatcher, with Indian blankets in background / OKLAHOMA 1907 / 2008 E PLURIBUS UNUM
QUARTER DOLLAR / UNITED STATES OF AMERICA / LIBERTY / IN GOD WE TRUST
KM#421
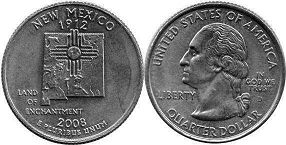
1/4 dollar 2008 New Mexico
State outline with relief, Zia sun symbol from flag / NEW MEXICO 1912 / LAND OF ENCHANTMENT / 2008 E PLURIBUS UNUM
QUARTER DOLLAR / UNITED STATES OF AMERICA / LIBERTY / IN GOD WE TRUST
KM#422
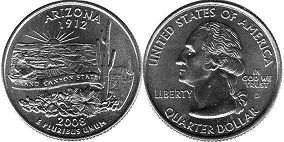
1/4 dollar 2008 Arizona
Grand Canyon, saguaro cactus / ARIZONA 1912 / 2008 E PLURIBUS UNUM
QUARTER DOLLAR / UNITED STATES OF AMERICA / LIBERTY / IN GOD WE TRUST
KM#423
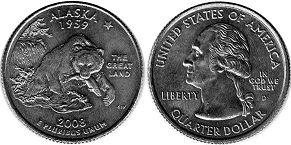
1/4 dollar 2008 Alaska
Grizzly bear with salmon and North Star / ALASKA 1959 / THE GREAT LAND / 2008 E PLURIBUS UNUM
QUARTER DOLLAR / UNITED STATES OF AMERICA / LIBERTY / IN GOD WE TRUST
KM#424
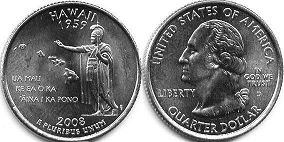
1/4 dollar 2008 Hawaii
Statue of Kamehameha I with state outline and motto / HAWAII 1959 / UA MAU RE EU O KA AINA I KA PONO / 2008 E PLURIBUS UNUM
QUARTER DOLLAR / UNITED STATES OF AMERICA / LIBERTY / IN GOD WE TRUST
KM#425
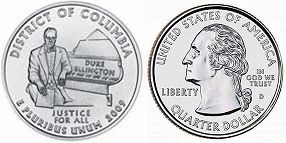
1/4 dollar 2009 District of Columbia
Duke Ellington seated at a grand piano / DISTRICT OF COLUMBIA / DUKE ELLINGTON / JUSTICE FOR ALL / E PLURIBUS UNUM 2009
QUARTER DOLLAR / UNITED STATES OF AMERICA / LIBERTY / IN GOD WE TRUST
KM#445
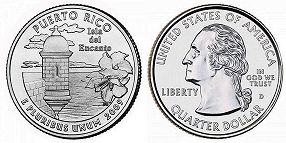
1/4 dollar 2009 Puerto Rico
Castillo San Felipe del Morro and a maga flower / PUERTO RICO / ISLA DEL ENCANTO / E PLURIBUS UNUM 2009
QUARTER DOLLAR / UNITED STATES OF AMERICA / LIBERTY / IN GOD WE TRUST
KM#446
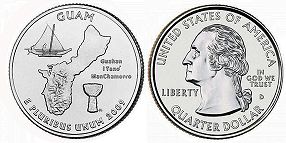
1/4 dollar 2009 Guam
Island, a proa boat and a latte stone / GUAM / GUAHAN I TANO MANCHAMORRO / E PLURIBUS UNUM 2009
QUARTER DOLLAR / UNITED STATES OF AMERICA / LIBERTY / IN GOD WE TRUST
KM#447
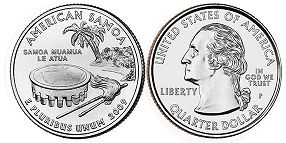
1/4 dollar 2009 American Samoa
Ava bowl, whisk and staff, coconut tree / AMERICAN SAMOA / SAMOA MUAMUA LE ATUA / E PLURIBUS UNUM 2009
QUARTER DOLLAR / UNITED STATES OF AMERICA / LIBERTY / IN GOD WE TRUST
KM#448
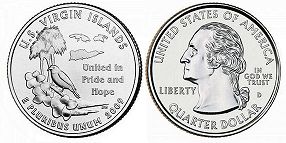
1/4 dollar 2009 U.S. Virgin Islands
Three islands, the bananaquit, the yellow cedar or yellow elder, and a tyre palm tree / U.S. VIRGIN ISLANDS / UNITED IN PRIDE AND HOPE / E PLURIBUS UNUM 2009
QUARTER DOLLAR / UNITED STATES OF AMERICA / LIBERTY / IN GOD WE TRUST
KM#449
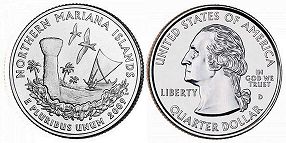
1/4 dollar 2009 Northern Mariana Islands
Latte, canoe, two white fairy terns, and a mwar / NOTHERN MARIANA ISLANDS / E PLURIBUS UNUM 2009
QUARTER DOLLAR / UNITED STATES OF AMERICA / LIBERTY / IN GOD WE TRUST
KM#466
Other US coins
Commemorative coins
America the Beautiful Quarters
5 cents Lewis and Clark's expedition
1 cent 2009 Lincoln Bicentennial
Costs of US 50 States Quarters coins in this catalog approximate and indicated specifically for the coin shown in the picture.
I do not buy or sell coins - this is just a catalog.

